
![]()
There’s no doubt that the Paperless Dev team is a group of polyglots, but our core application is still a Ruby on Rails app. There’s also no question that we’re obsessed with performance. Not only do our users expect us to be fast, but our uptime during our peaks is highly dependent on how quickly we can handle requests. For the past three years, we’ve had a tradition of spending the month of October focused on improving our speed and paying down our technical debt. We call it Oktoperfest (misspelling intentional), and every year it gets better.
Over the past year especially, our tools and the tools from the community for diagnosing and fixing the performance of Rails apps have improved dramatically. Here I’ll share a brief overview of the some of the tools we use daily.
Graphite
We’ve talked extensively about Graphite before and we continue to use and improve our Graphiti frontend. Our primary method for consuming the Graphs is through our daily reports. Every morning I get a bunch of emails with a bunch of statically snapshoted graphs.
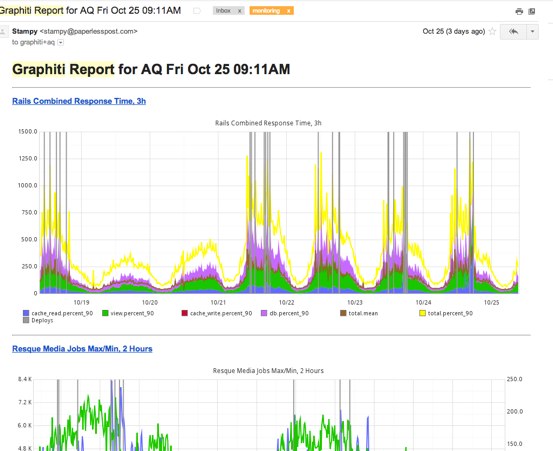
I’ll peruse through them on my way to work and see if there’s anything out of the ordinary. Besides our one off counters and timers, we use a patched version of Rails 2.3 to send general controller timings through a ActiveSupport::Notifications. We catch these notifications in what we call the RequestSubscriber, which is an ActiveSupport::LogSubscriber collects all these notifications and then collates them into info related to a specific request. This then gets delivered to graphite through Statsd and also written to our rails logs in a unified format similar to lograge
Logs
An example log line looks like:
1 2 3 4 5 6 | |
As you can see theres a LOT of info here. Since we have a large number of servers at this point, surfing through log files (even when collected on a central log server with rsyslog) can be almost impossible. Additionally, we rarely care about a single request, rather when trying to diagnose a slow controller action or a jump in response time, we want to look at a sample of requests to a single endpoint. This is where logstash comes in. Using this unified format and a simple filter, we’re able to search for a single endpoint or even a single node and see live and historical data. Right now we keep logs in logstash for 2 days and everything else is backed up and shipped off site. This data is so valuable because unlike Graphite/Statsd it is not averaged or summarized. Fairly often, we’ll find problems where the mean or even 90th percentile of response time for an endpoint is low, but this belies the fact that though many requests are fast, there will be some that are so slow that it has an adverse effect on total performance. By looking at a sample of the actual requests we can see these anomalies and the to find out why.
Performance Bar

When browsing the production site it’s really useful to have information about the current request in plain view. We call it the performance bar, and its a little red bar at the top of every page. Tools like Peek can do this for you simply, but we already have all the data we need in our RequestSubscriber. All the performance bar does is subscribe to the notification in a middleware and inject all the data into the page as JSON. Then some simple JS renders it on the screen all pretty like. We also suggest using Sam Saffron’s MiniProfiler project, which gave us a ton of useful data but ended up not fitting our needs exactly.
In development and staging, some of our favorite MCs represent different useful tools:
- Daddy Mac of Kriss Kross is “Jump”, a set of quick links to different parts of the site.
- Ludacris lets you “Rollout” different features to yourself
- The RZA lets you toggle Caching in development and
- Large Professor lets you re-run the current request with rblineprof
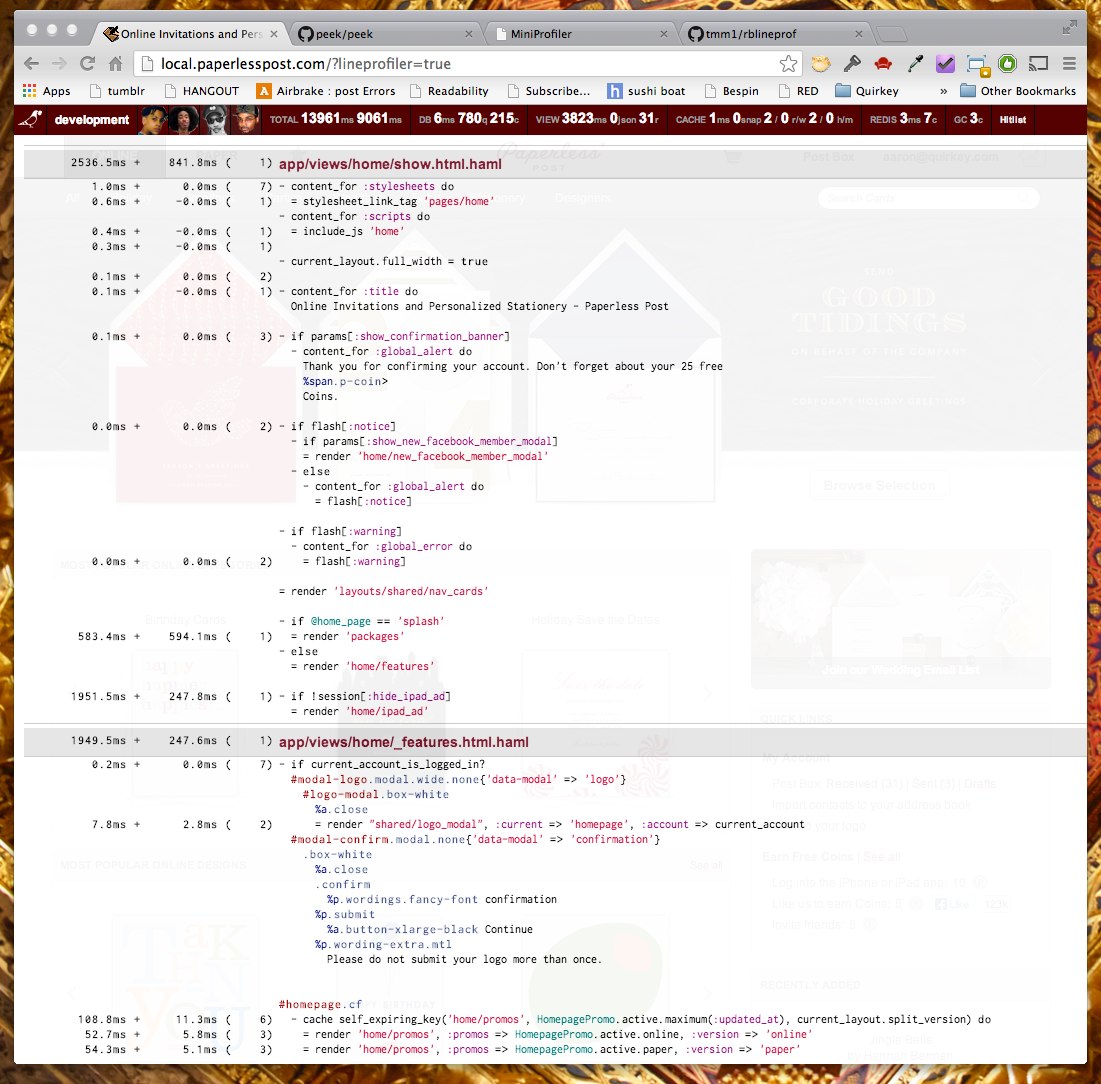
rblineprof
rblineprof is definitely one of the single most useful tools to come into the ruby spectrum in a long time. Thanks to Aman Gupta (@tmm1) we can now see what individual lines and blocks of our code take the most time or (CPU time) in a request. Though, its not always perfect, this can be extremely useful for quickly narrowing down on the most problematic parts of a code path. We use a slightly modified version of the code in peek-rblineprof to render syntax-highlighted code with the timings on the left. This can be invoked in staging or development by just clicking on the Large Professor.
ppprofiler
Once we felt the power of rblineprof, we wanted more. Specifically, once we identified a slow action or section of code, we wanted a way to repeatedly run the code, before and after making changes to track our progress. We also wanted a way to report these improvements to the rest of the team. For this, we created the “Paperless Profiler”, which is a script that can be invoked with:
1
| |
This does a number of things that are pretty clearly summed up in the classes run method:
1 2 3 4 5 6 7 8 9 10 11 12 13 14 15 16 17 18 19 20 | |
It runs raw benchmarks (using Benchmark.measure), it collects sql, cache, and Redis counts, and it runs rblineprof. It also does all of these with the cache enabled and with it disabled. It then takes all of this data and formats it in a simple Markdown template. This has the advantage of easily being piped into gist or pasted into a github issue. You can see some sample output here. I’ve shared the full code as a gist and though it can’t be run as is out of the box (it relies on some PP variables), it should be easy enough to modify for your needs.
Find and destroy
Together, we use all of these tools to identify our problems, try to catch them quickly, and pin down the actual source. The actual solving of the issues often comes down to just “doing less”. This means either less things uncached, less things in the request/response cycle (moving to background jobs/threads) or just eliminating unused code.
Though Ruby still has its issues, there are some great tools and some even cooler things on the horizon. One of the things that’s often most problematic and we’re most interested in is tracking down Ruby memory usage problems. Sam’s MemoryProfiler though only functional on Ruby HEAD, is extremely promising. Charlie Sommerville and Aman have also been pushing some amazing work to the Ruby language itself, and we’re watching closely. Stay tuned as we continue to write more about the tools we’re using at PP.